Dosages, Concentrations, and Limits
We decided to depict two levels of potential exposure in our modeling (note: a dosage is the amount or concentration of the agent to which a person at that location is exposed over a specific period of time):
- First noticeable effects. This is the dosage that would be expected to cause watery eyes, runny nose, tightness of chest, muscle twitching, sweating, and headache. Increasingly higher dosages would produce vision impairment, imcapacitation, and death.
- General population limit. The dosage below which the general population, including children and older people, could be expected to remain 72 hours with no effects. (See figure 17 on toxicity.)
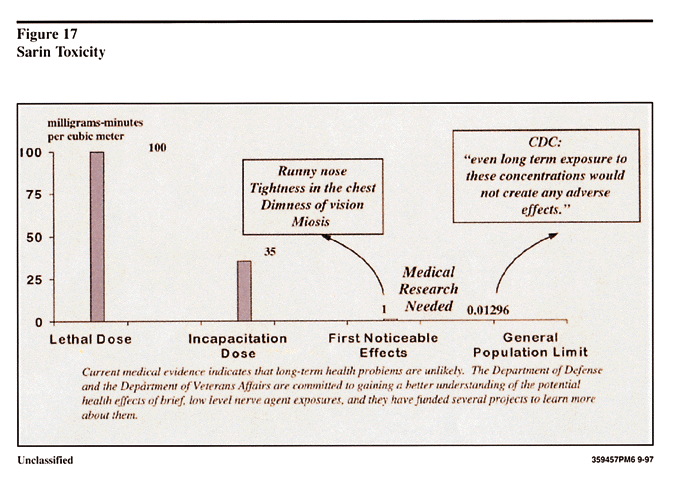
Figure 17. Sarin Toxicity
To understand the magnitude difference between the levels, note that the general population limit dosage (.01296 milligram-minute per cubic meter) is one-eightieth of the dosage expected to produce noticeable effects (1 mg-min/m3). But the area between these levels, which we will call the area of low-level exposure for this report, is the area for which medical research is needed. The exposure at Khamisiyah was relatively brief, measured in hours, not weeks, as would be the case with low-level occupational exposures. The coordinated efforts of VA, DoD, and HHS are ensuring research into better understanding this exposure issue.
Last Year's 50 Kilometers and 20,000 Troops
Last October, when it became clear that meaningful modeling of a potential release from the pit had come to a halt, DOD used the first noticeable effects limit to define a circle around Khamisiyah. On the basis of available literature and discussions with experts, DOD determined that one would have expected to see noticeable effects within 25 km of the demolition. Given the uncertainties at the time, DOD doubled that, and it was assessed that roughly 20,000 troops were within the 50-km circle so defined. DOD used this assessment as a basis for mailing almost 20,000 surveys in an attempt to get additional information from the people that had been near Khamisiyah at the time of the demolition. DOD received 7,400 responses to the surveys, with over 99 percent showing no physical effects that could be correlated with exposure to the chemical warfare agent sarin.
Figure 18 depicts the Kuwaiti Theater of Operations with last year's 50-km circle around Khamisiyah and DOD's current understanding of military unit locations. Each dot represents where company-size units were located based on DOD's S3-G3 conferences. These conferences helped develop much better fidelity on the locations of troops, allowing DOD to move from battalion-level accounting to company-level accounting. While that has been completed for all of XVIII Airborne Corps, it is not complete for the VII Corps. The S3-G3 conference for VII Corps is scheduled for September. The analysis that follows uses battalion-level data for the VII Corps; with more refined data the numbers are likely to be slightly lower.
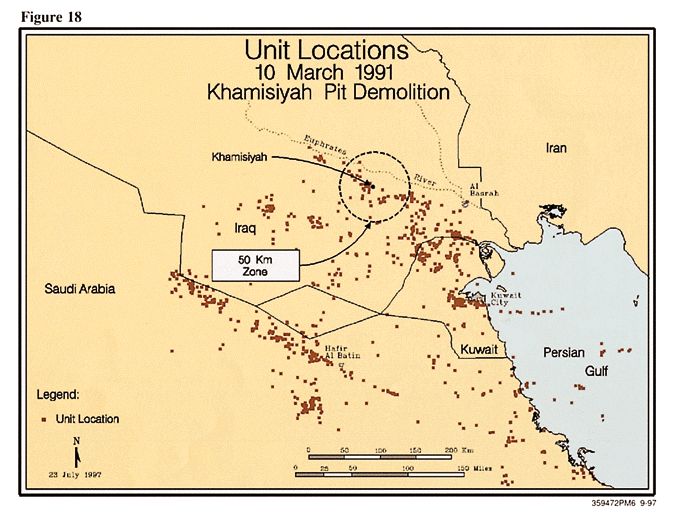
Figure 18. Unit Locations March 10, 1991, Khamisiyah Pit Demolition
The Plume Over Four Days
A closer look at the area with figure 19 shows the area of first noticeable effects on the first day (from 4:15 p.m. on March 10, 1991 to 3:00 a.m. on 11 March). This area is well within DOD's 50-km first-effects area from last year's survey effort.
The next map (figure 20) shows a closer view of the first-effects portion of the plume, which is about 20 km long and five km wide. No military units were located under the first-effects portion of the plume, which is consistent with the lack of reported effects and with DOD's survey results, which had over 99 percent of the respondents showing no signs of physical effects that could be correlated with exposure to sarin. The troops that performed the demolition had evacuated the area. As stated earlier, we know that one soldier involved in the demolition drove briefly through the smoke from the explosion. He had no ill health effects.
The small, 1.5-km-long peanut shape near the pit represents the area where DOD believes chemical alarms would have gone off had they been used. A note of caution, however: all plume areas depicted in this report are based on dosage levels--concentrations over time. The alarms are designed to go off based on concentrations, recycling every 20 seconds, that would cause incapacitation or death.
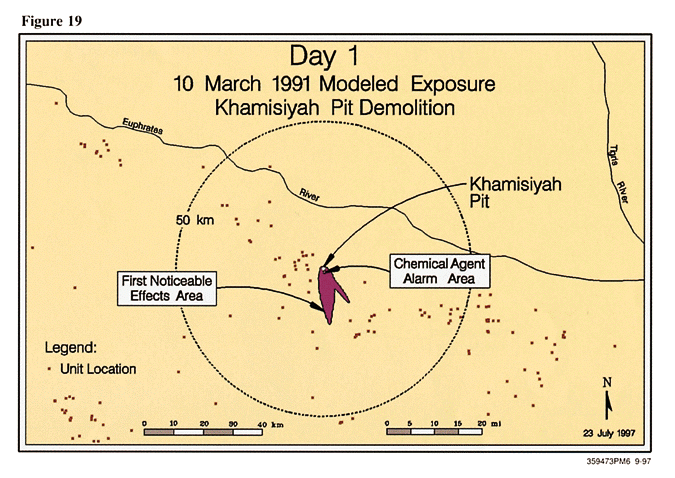
Figure 19. Day 1: March 10, 1991, Modeled Exposure Khamisiyah Pit Demolition
The offshoot portion of the plume is a product of using a composite or union approach in our modeling. While all five models produced first effects plumes for the first day that pointed south; one model also depicted a portion of the plume moving to the southeast. Our inclusion of the latter model graphically illustrates our approach in drawing the outer boundary of the overlaid plumes.
The next map (figure 21) shows the first-effects plume for the second day. It is an area about six km across and six km deep. This is the result of a smaller area being generated by the evaporation of agent from the soil and wood. This evaporation is a critical component of the plume, making up almost 90 percent of the plume. We would not have expected the evaporation from the wood without the Dugway testing. We had thought there would be an instantaneous release into the atmosphere with some evaporation from the soil, but the Dugway testing showed that the spill into the wood and subsequent evaporation would be a very important factor.
By the third day, as the next map (figure 22) shows, the evaporation is not producing dosage levels above the first noticeable effects limit. However, the evaporation makes the low-level event last a few days.
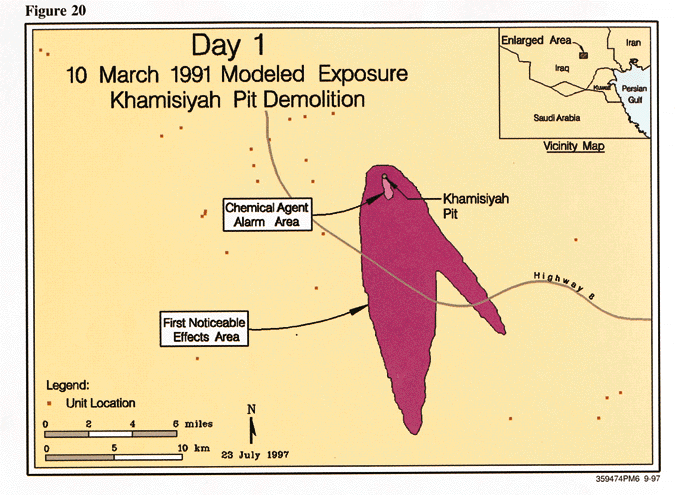
Figure 20. Day 1: March 10, 1991, Modeled Exposure Khamisiyah Pit Demolition
Figure 23 depicts the low-level exposure area, extending to the general population limit, for the first day. The wind has driven the chemical cloud south-southwest, extending almost 300 km and into Saudi Arabia. This potentially exposed almost 19,000 troops to low levels of chemical warfare agent. Remember that this plume is the composite of five models; the plumes from each individual model predicted smaller exposure areas. We used the composite approach to increase our confidence that the resulting plume would be our best estimate of the potential area covered, taking into account individual model biases. This approach was critical for notifications and for future epidemiological studies. However, we do not expect that everyone under the composite plume was exposed.
The map for the second day (figure 24) shows the effects of significant wind changes, thickening the plume and shifting it toward the west. This is the day of the highest potential low-level exposure, possibly affecting 79,000 troops, including some at King Khalid Military City. The initial cloud continued to move downrange, and the constant evaporation of agent from the sand and wood continued to refresh the plume, sending new tendrils from the pit.
By the third day (figure 25), the agent in the atmosphere in the south had dispersed to levels below the general population limit. Evaporation continued to feed the plume, which, because of additional wind changes, was moving several directions, predominantly up the Euphrates valley. Up to 3,300 troops were exposed on this day.
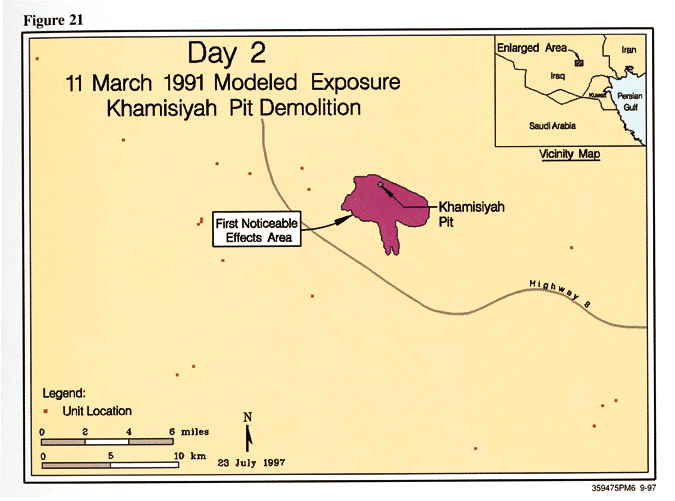
Figure 21. Day 2: March 11, 1991, Modeled Exposure Khamisiyah Pit Demolition
The map for the fourth day (figure 26) shows a small plume from evaporation moving to the northeast, potentially exposing two battalions of troops there, about 1,600. After that, any additional evaporation did not exceed the general population limit.
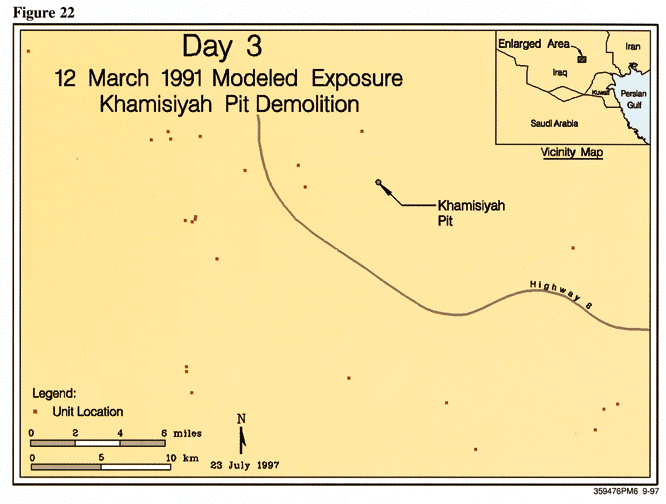
Day 3. March 12, 1991, Modeled Exposure Khamisiyah Pit Demolition
The table reflects the daily totals. As already indicated, no units appear to have been exposed to dosages causing first noticeable effects. Moreover, the daily numbers for low-level exposure do not sum to the total exposed population, because some troops would be counted on multiple days. The total, eliminating double-counting, is nearly 99,000.
